- Welcome
- Home
- Tasks
- Documents
- Service Desk
- Chat
- Organizations
- Contacts
- Board
- Team
- Products
- Accounting
- E-Bank
- Search
- Calendar
- Telephony
- Administration
- Groups
- Users
- Activation
- Articles
- Backup
- Connection
- Console Commands
- Export
- Firewall
- Overview
- Import
- Import from AD
- Journal
- Service Operations
- Modules
- News
- Permissions
- Requests
- Security
- Settings
- Sounds
- Statistics
- Updating
- Projects
Journal
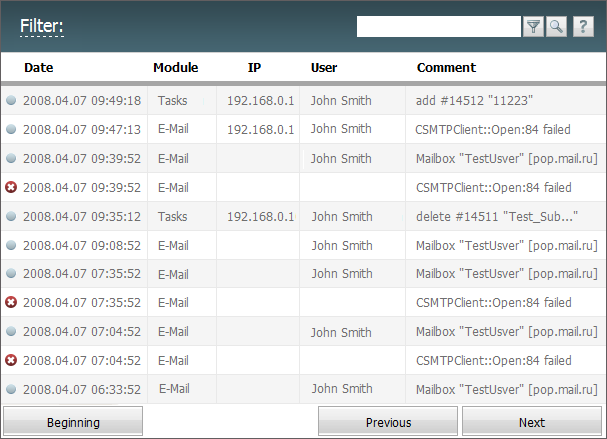
You can monitor the logs of system events in TeamWox using this tab:

The information is represented in five columns:
- Date — the date and time of the event.
- Module — the name of module the event happened in.
- IP — the IP address, from which the performed actions have been requested. The integration of TeamWox with GeoIP service allows viewing the country and city an IP address belongs to. To do it, put the mouse cursor of an IP address.
- User — the name of the user requested TeamWox to perform an action.
- Comment — shows the description of the event.
The ![]() icon located to the left of the event date shows that this event is classified as an error, so it should be carefully examined and eliminated.
icon located to the left of the event date shows that this event is classified as an error, so it should be carefully examined and eliminated.
The ![]() icon shows that this event is classified as a warning, so it should be carefully examined too.
icon shows that this event is classified as a warning, so it should be carefully examined too.
The ![]() icon shows that this event is classified as information.
icon shows that this event is classified as information.
The ![]() icon identifies the debug information (it is generated not only if an error occurs in TeamWox error, but also at network problems, etc.). The events of this type are more detailed, they can be sent to the developers if a real error occurs at system working.
icon identifies the debug information (it is generated not only if an error occurs in TeamWox error, but also at network problems, etc.). The events of this type are more detailed, they can be sent to the developers if a real error occurs at system working.
You can switch between pages by pressing the "Previous" and "Next" buttons located at the lower part of the tab. In order to return to the beginning of the events list, you should press the "Beginning" button.
The feature is that the list of events is not updated every time you press the "Previous" or "Next" buttons. For each page, the list is formed of the events that have already happened. However, if you press the "Beginning" button, the new events will be added to the beginning of the list.
Filters
You can set up filters on this tab. To do it, you should press the "Filter" button located at the top part of the tab. The following window will appear, as soon as you press it:

- To search events containing a certain word or phrase, you should type them in the "Keyword" field.
- If you want to monitor the event of a certain module, you should choose its name from the list that opens, if you press with your mouse on the "Module" field. This list contains all the modules available in TeamWox at the moment.
- In the "Period" field, you can enter the start and the end date of events to be selected. It can be done by pressing on
 . The window of calendar appears, as soon as you press it. The instructions of how to manipulate it are given in the "Interface Description -> Calendar" section.
 - If you want to monitor events related to a certain user, you can specify his/her name in the "Users" field. The standard TeamWox window of assigning users will appear as soon as you press it. The detailed instructions of how to manipulate it are given in the "Interface Description -> List of Assigned" section.
- You can choose the type of event in the "Status" field: all, all (except Debug), information, error, warning, debug, unknown.
- You can clear all conditions of the filter by pressing the "Clear" button.
Once all necessary options have been set up, you should press the "Apply" button. At the same time, only events that match the filter conditions will appear in the list.
There is also a possibility of temporary filtering the journal entries without creating a permanent filter as it is described above. To do it, you should type the necessary combination of characters in the search line and then press the  button. The search during the filtration is performed by a substring, i.e., only the entries should be listed, in whose fields the entered combination of characters is found.
← Requests
Statistics →
|