- Welcome
- TeamWox Communicator
- Diagrams
- Editor
- Templates
- User Details
- Getting Started
- Browser Settings
- Calendar
- Calls
- Charts
- Exit
- File Viewers
- Filters
- Notifications
- Certificate Installation
- Interface
- List of Assigned
- Mind Map
- Permissions
- Search
- Status
- Google Translate
- Windows
- Home
- Tasks
- Documents
- Service Desk
- Chat
- Organizations
- Contacts
- Board
- Team
- Products
- Accounting
- E-Bank
- Search
- Calendar
- Telephony
- Administration
- Projects
Diagrams
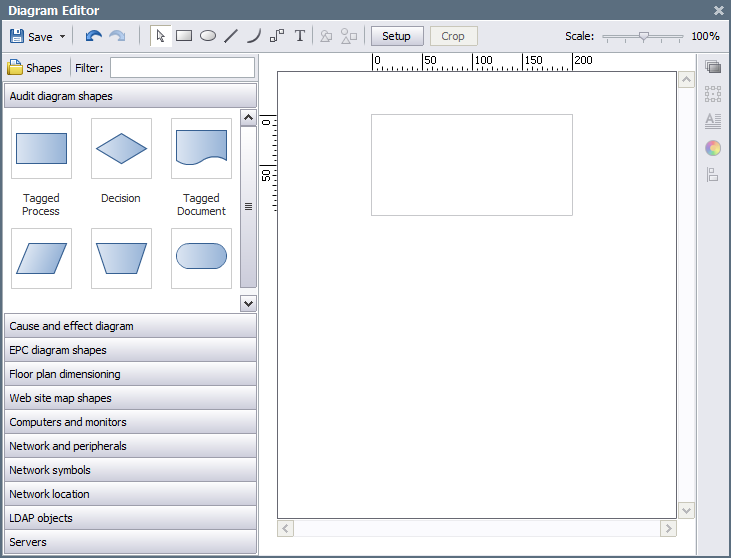
The feature of creating diagrams and attaching them to messages is implemented in the TeamWox system. In order to create a diagram you should press the  button located in the lower part of the message editor. The window of the diagram editor will be opened as soon as you do it:

Upper Toolbar
The upper menu of the diagram editor contains the following commands:
 (Ctrl+S) — save the diagram. By pressing the down arrow you can open a submenu, using which it is possible to save the diagram as a picture of the PNG format.
 (Ctrl+Z) — undo previous action.
 (Ctrl+U) — redo previously cancelled action.
 — switch the cursor to pointer mode.
 (Ctrl+8) — switch to rectangle creation mode.
 (Ctrl+9) — switch to oval creation mode.
 (Ctrl+6) — switch to line creation mode.
 (Ctrl+7) — switch to curve line creation mode.
 — switch to connector creation mode.
In order to create one of the figures mentioned above on the list you should press the left mouse button and shape a figure holding it. |
 — group selected figures for managing them together. You can select several figures by holding "Ctrl" key.
 — disjoint a group of figures.
- Setup — open the window of scene (working area) properties.
- Crop — crop the working area by the borders of diagram shapes.
- Scale — using the lever one can adjust the scale of the working sheet.
Objects Menu
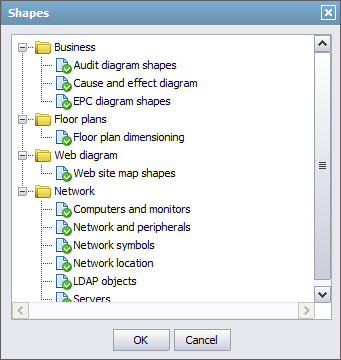
Left part of the diagram editor contains the menu of objects that can be inserted. In order to adjust the list of groups of figures displayed in the menu, one should press the  button. The following window will be opened as soon as it is pressed:

In order to select or exclude a group, one should click with the left mouse button on its icon located to the left of its name. Enabled groups are marked with the checkmarks.
The following groups of objects are implemented in the diagram editor:
- Audit Diagram Shapes — audit diagrams are intended for documenting and analysis of different processes.
- Cause and Effect Diagram — this type of diagrams is intended for picturing the causes of occurring of different events.
- EPC Diagram Shapes — EPC (Event-driven Process Chain) diagrams are intended for describing business processes as a sequence of alternating events and functions.
- Floor Plan Dimensioning — shapes for drawing different room plans with the specification of sizes.
- Web Site Map Shapes — shapes for representation of website maps.
- Computers and Monitors — set of shapes of computers and monitors.
- Network and Peripherals — shapes for displaying the network environment and peripheral devices.
- Network Symbols — shapes for representation of devices for networking.
- Network Location — a set of figures that represent different locations.
- LDAP objects — a set of figures of Lightweight Directory Access Protocol.
- Servers — set of shapes of different types of serves.
The "Filter" field is intended for fast searching of shapes by their names. In order to apply filtering, one should type the first symbols of a shape name.
Each group contains a lot of figures to create diagrams. In order to open one or another group you should click on its name with the left mouse button. To move a figure to the sheet you should click on it with the left mouse button and holding it drag to the necessary position. The detailed description of operations with figures is given at the corresponding section.