- Welcome
- Home
- Tasks
- Task Types
- Create/Edit Task
- Fast Filtration
- Task Filters
- Task List
- Permissions
- Task Privacy
- Reports
- Task Statuses
- View Tasks
- Tasks Widgets
- Documents
- Service Desk
- Chat
- Organizations
- Contacts
- Board
- Team
- Products
- Accounting
- E-Bank
- Search
- Calendar
- Telephony
- Administration
- Projects
Reports
The module of "Tasks" provides the possibility to form reports. To view the reports, you should press the "Reports" button located in the top part of the "Tasks" tab, to the right of the "New task" button.
Once you have pressed this button, the task status tabs are replaced with the tabs of reports types. There are three types available:
Users
This report allows you to view the user's task-using activity, the amount of individual incoming and outgoing tasks. The report is represented as a histogram:
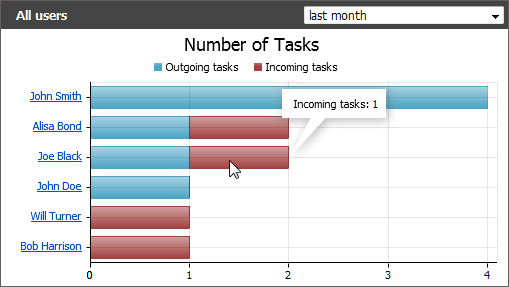
A pop-up tip will provide the information about the number of incoming/outgoing tasks, as soon as you put the cursor of your mouse over a histogram bar. Blue bars represent the number of outgoing tasks, red bars represent that of incoming ones.
The possibility of scaling the histogram by incoming or outgoing tasks is provided. To do it you should press with the left button of your mouse on a red or a blue bar. The same time the histogram will be rescaled by the maximum value of the chosen bars. To return to the initial state of the histogram you should press the "All series" button located in its legend.
Groups
The report on the "Group" tab represents the amount of incoming tasks assigned to a group:
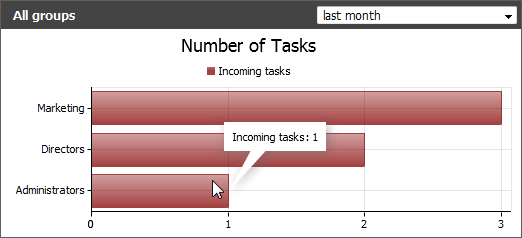
The pop-up tips representing the information about the amount of tasks are implemented, too.
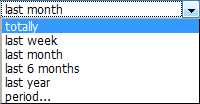
For both types of reports, there is a possibility to choose the reporting period. You can do that via the list that opens if you press on the field located in the report header:
Growth
The "Growth" report displays the statistics by tasks increase and by their total amount:
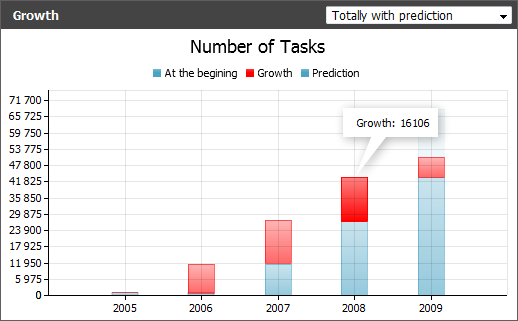
This report can be viewed in three modes:
- Last year — this report represents the histogram that displays the amount of tasks created in the system by months within a year.
- Totally by years — this report represents the histogram that displays the amount of tasks by years (blue bars), as well as their annual growth (red bars).
- Totally with prediction — this report is nearly the same as the previous one, except for the appearance of the additional semi-transparent section on the last bar. This section is drawn on the basis of tasks amount that were added within the last year and the time left till its end. It represents the presumed amount of tasks that can be created till the end of the year.
You can choose the necessary type through the list located in the upper right corner of the report:

Reports that represent statistics by annual growth also can be rescaled by the amount of existing tasks for the previous period (blue bars) and by the growth for the current one (red bars). To do that you should click on one of them.
Using the context menu, one can print any report or export it in *.XLSX, *.XML, *.CSV or *.PNG formats. |