Chart
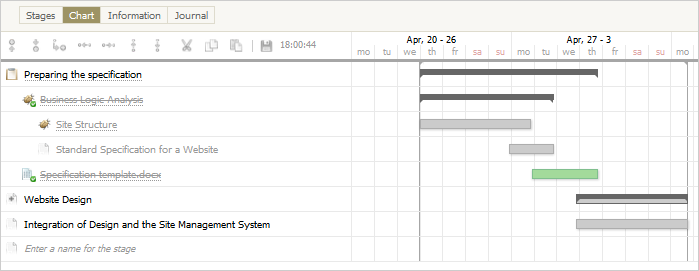
The convenience of the "Chart" tab is the simultaneous display of both the structure of the plan, and its chart on the calendar. The purpose of the tab is to help you plan the timing and duration of stages visually, directly in the calendar.
Work with the plan structure and its stages is absolutely similar to operations described in the "Stages" tab.
The calendar schedule is a weekly calendar, on which stripes denoting the length of the stages are marked. The stripes can be of free different colors depending on the stage properties:
- Green means that the stage is closed.
- A light gray stripe denotes a stage that is currently in operation or has not started yet.
- A dark gray stripe denotes the total length of the stage and all its substages.
Project start and completion date are indicated with a vertical gray line in the calendar.
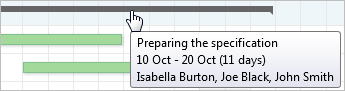
If you hover your mouse over a duration stripe or click on it, a tooltip appears showing brief information about the stage:
- Stage title.
- Stage start date.
- Stage end date.
- Stage duration.
- Users responsible for the stage.
The schedule configuration is based on the Drag'n'Drop method.
To create stage performance term, click on an empty cell in the calendar next to the name of the corresponding stage. This will create a duration stripe, which can be increased or decreased using by dragging its end. If the stage duration is ok, but you want to change the start and end date, move the entire stripe. To do this, left click on the inner space of the stripe and drag it left or right depending on the desired dates.
← Stages
Information →
|