- Welcome
- Home
- Tasks
- Documents
- Service Desk
- Chat
- Organizations
- Contacts
- Board
- Team
- Products
- Accounting
- E-Bank
- Search
- Calendar
- Telephony
- Administration
- Groups
- Users
- Activation
- Articles
- Backup
- Connection
- Console Commands
- Export
- Firewall
- Overview
- Import
- Import from AD
- Journal
- Service Operations
- Modules
- News
- Permissions
- Requests
- Security
- Settings
- Sounds
- Statistics
- Updating
- Projects
Statistics
This tab is used for monitoring the work of the TeamWox server. Statistics is gathered and stored for the last 10 days. 4 parameters are monitored:
Data Transmitted
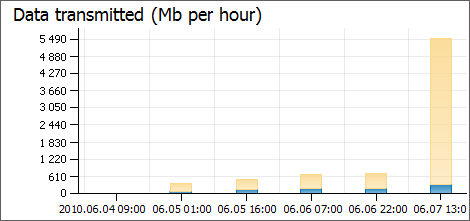
This diagram displays the amount of data transferred from the TeamWox server (yellow bars) and the amount of data received by the server (blue bars) by hours.
If you put the cursor of your mouse over the bars in diagrams, the pop-up help containing the corresponding information appears. There is a possibility to scale histograms that have two types of data. To do it, you should press with the left button of your mouse on a bar. At the same time, the histogram is rescaled by the maximum value of the chosen bars. To return to the initial state of the histogram, you should click with the left button of your mouse again on any bar. |
CPU Usage
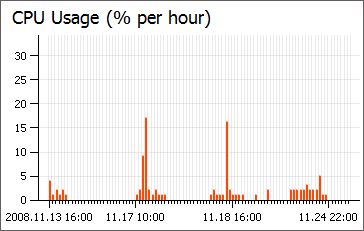
This diagram displays the information about the CPU usage (in percents) by the TeamWox server by hours.
Memory Allocated
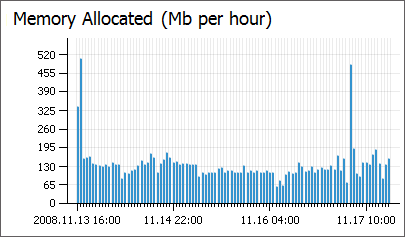
The diagram shows the amount of physical memory allocated for the TeamWox server process by hours.
Users Online
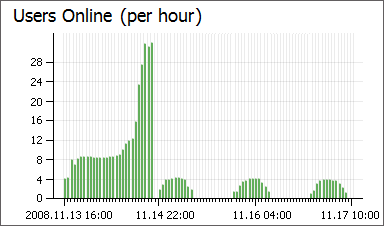
Here you can view the statistics of users that are connected to TeamWox by hours.
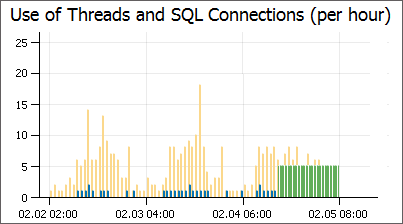
Use of Threads and SQL Connections
The certain number of threads intended for the exchange of data between users and the server is allocated for TeamWox functioning. The maximum number of threads depends on the number of users created in the system. Most threads stay passive until users begin to exchange data with the server. Depending on the number of users that exchange data with the server, some threads become active. Yellow bars of this diagram show the number of active threads. Also separate threads (public) are allocated for the data transmission through the "Chat" module (when requests are sent from external websites). The number of these threads is shown as blue bars in the diagram.
This diagram also displays the number of SQL-connections (greens bars).
Read from Files/Cache
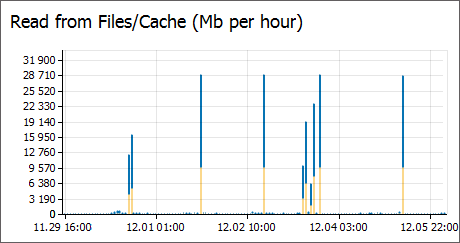
This diagram shows the amount of data (in megabytes) read from the files storage of the system (blue bars) and from the cache (yellow bars).
Using the "Export" button, located in the upper part of the tab, you can export the statistical report as a table to an HTML file. |
Context menu of the statistical chart allows to execute the following commands:
- Save as picture (.png) — save the chart as an image in the *.png format. The same action can be performed by pressing the "Ctrl+S" hot key.
- Print — open the chart print window.
- Download — save the source *.xml file of the chart to the PC.