Activity
This tab displays the report on a user's activity of using different modules of the system. The reports on different modules are shown in separate boxes; each of them can be hidden using the ![]() button.
button.
In the upper part of the tab, you can select a period for displaying the statistics of using the modules of TeamWox.
The statistics is calculated for the following modules:
Tasks
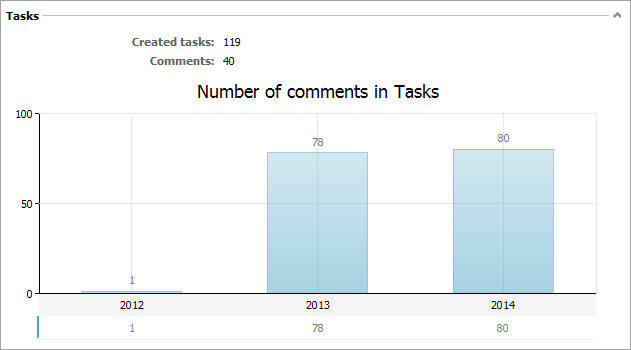
The upper part of this box contains the following rates of using tasks:
- Created tasks — number of tasks created by the user.
- Comments — number of comments written to all tasks.
The diagram of distribution of comments by years is shown below.
Documents
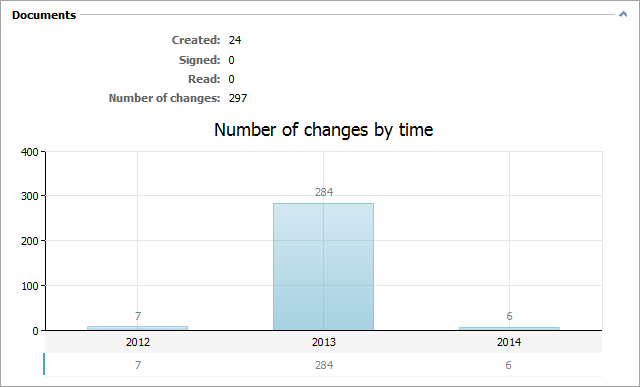
This section displays the user's activity of working with documents:
- Created — number of documents created or added by the user.
- Signed — number of documents signed by the user.
- Read — number of documents read by the user.
- Number of changes — number of changes of documents made by the user. Changes include editing of documents, signing, reading.
Below you can the diagram of changes of documents by years:
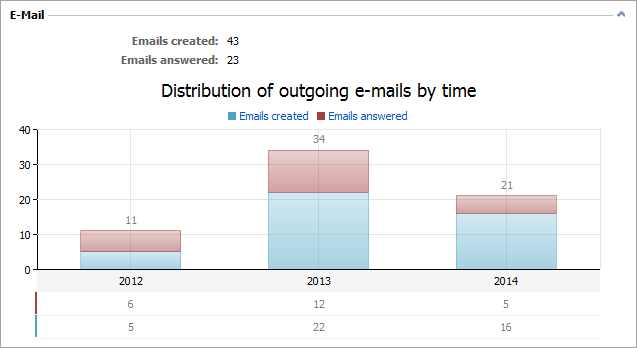
The information about the activity of using the "E-Mail" module is displayed here:
- Emails created — the number of emails created (and sent) by the user.
- Emails answered — the number of emails answered by the user.
Below is a diagram of distribution of incoming emails by time:
Board
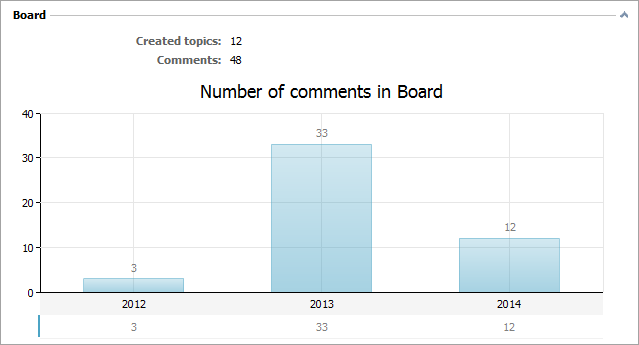
The information about the activity of using the "Board" module is displayed here:
- Created topics — number of board topics created by the user.
- Comments — number of comments written to all topics of the board.
The diagram of distribution of comments by years is shown below.
Organizations
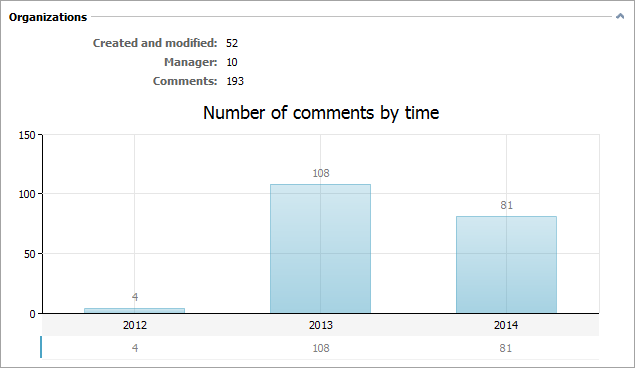
This section displays the activity of using the "Organizations" module.
- Created and modified — number of organizations created and modified by the user.
- Manager — number of organizations where the user is assigned as a manager.
- Comments — number of comments written to the history of all organizations.
The diagram of distribution of comments written to the history of organizations by years is shown below.
Contacts
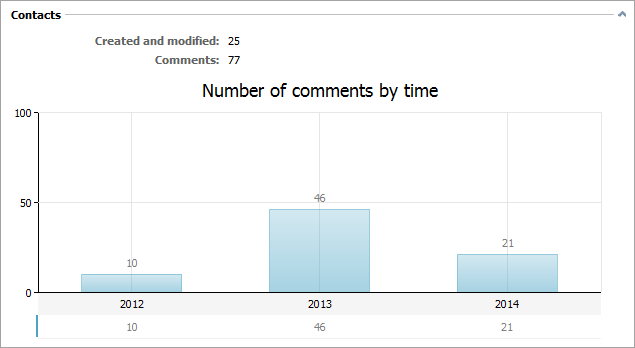
This section displays the activity of using the "Contacts" module:
- Created and modified — number of contacts created and modified by the user.
- Comments — number of comments written to the history of all contacts.
The diagram of distribution of comments written to the history of contacts by years is shown below.
Chat
This box displays the information about the activity of using chat.
- Internal — number of internal dialogs of the user.
- Public — number of public dialogs the user participated in.
Two diagrams are displayed next.
Number of public dialogs
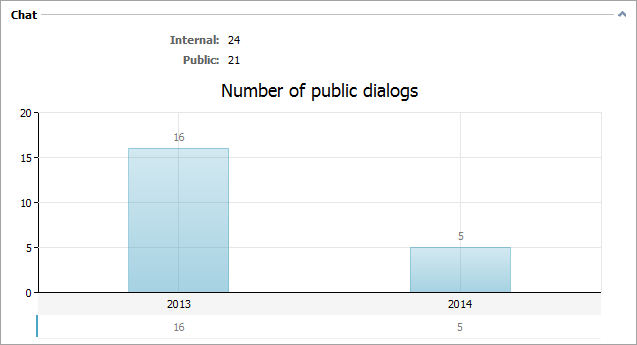
This diagram shows the distribution of public dialogs of the user by years.
Distribution of rates
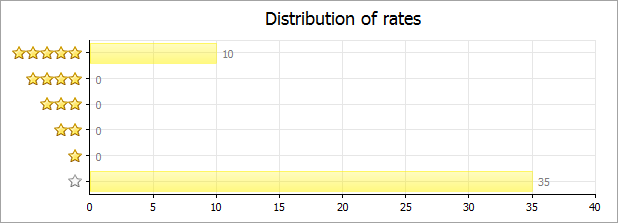
The public component of the "Chat" module allows people to rate the dialogs with the employees when they contact your company. This diagram displays the distribution of rates given to the dialogs the user participated in.
In the lower part of the "Chat" box you can find the table, which represents the number of dialogs assigned to different organizations in the system:

Service Desk
This box displays the activity of using the "Service Desk" module.
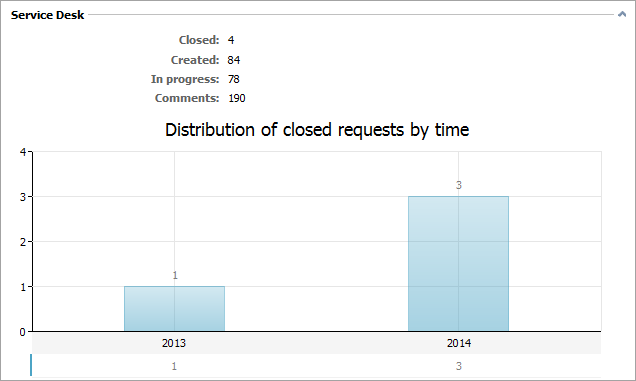
- Closed — number of requests closed by the user. The user should be either their author, or an assigned user or selected as responsible for these requests.
- Created — number of requests created by the user.
- In progress — number of personal requests of the user that are currently open. The user should be either their author, or an assigned user or selected as responsible for these requests.
- Comments — total number of comments of the user written to all requests.
A request is accounted as "Closed", "Created" and "In progress" only if the user has added at least one comment to it. Creation of a request is treated an added comment.
The diagram of distribution of number of requests closed by the user is shown below.
